 Fig.1 : A Moodle course containing fill-in-the-blank questions |
This page provides information about the above paper presented at WCCE2022.
Typical screenshots representing a sample fill-in-the-blank question and a learning process of a student
Confirmation of learning logs by teachers
Presentation (pdf)
We shall present typical screenshots which students will see during the learning of object-oriented programming using our system.
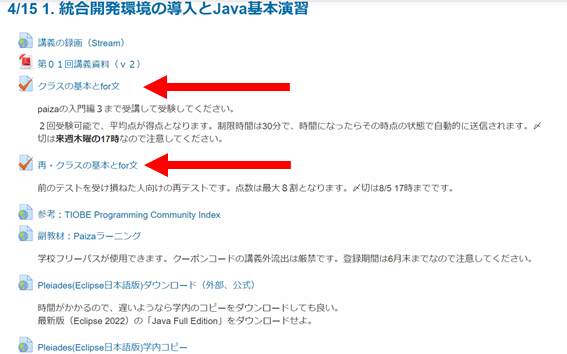
Step 1. A student logs into our Moodle course and selects a quiz according to our instruction. The left arrow points to a quiz in the following figure.
Fig.1 : A Moodle course containing fill-in-the-blank questions
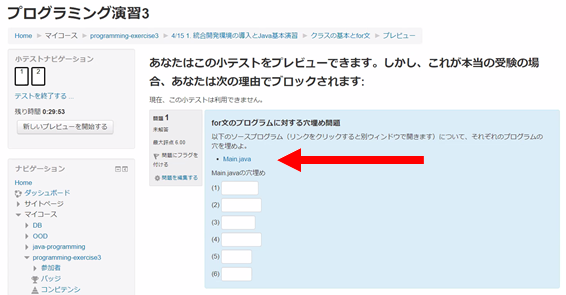
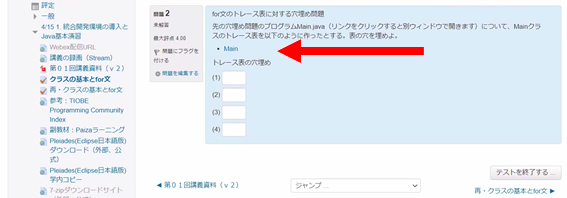
Step 2. When the student selects a quiz, the student will find an cloze question like Fig. 2 or Fig. 4. When the students clicks a link within a question, the student will find a program (Fig. 3) or a trace table (Fig. 4) with blanks in a separate tab on the web browser.
 |
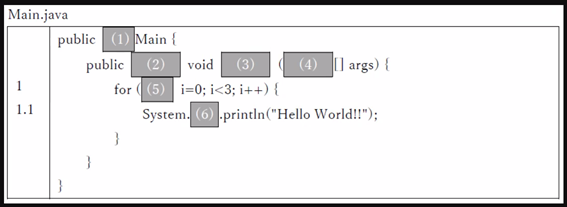 |
| Fig.2 : Example of Question whose type is Program | Fig.3 : Program with Blanks |
 |
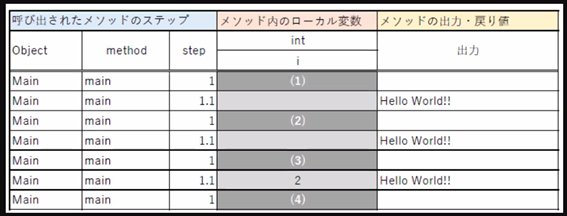 |
| Fig.4 : Example of Question whose type is Trace Table | Fig.5 : Trace Table with Blanks |
Step 3. The student can submit the answer after the students fills the blanks in Fig. 2 or 4. Then the student can review the scoring result as shown in Fig. 6.
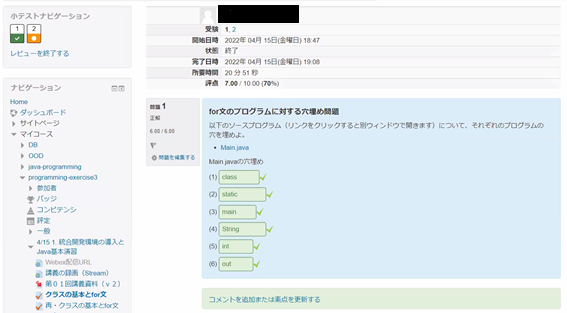 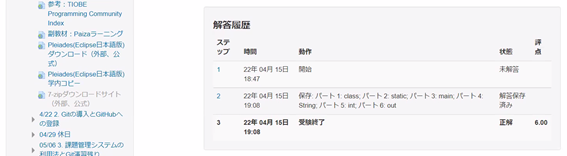  Fig.6 : Scoring Result |
 Fig.7 : Confirmation of Correct Answers |
View 1. Teachers can view the answer log as shown in Fig. 8. The answer log contains student ID number, name, email address, status,
start date, end date, time required, grade, and score for each question.
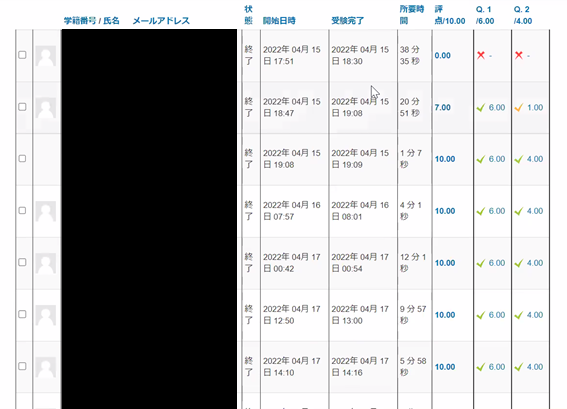 Fig.8 : List of answer logs |
View 2. Teachers can check the distribution of scores as shown in Fig. 9.
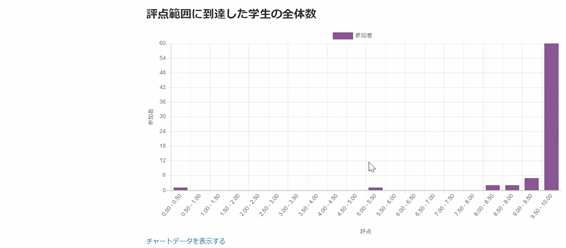 Fig.9 : Score Distribution |